Wednesday, February 23, 2011

Risk is high in this area....


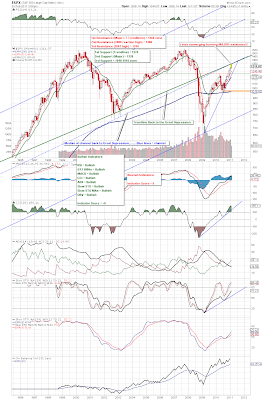
Right now risk, as measured by the Gold-to-Silver ratio, is at the same height as it was at the peak of the Dot.com bubble and the top of the housing bubble. It probably isn't a great time to be long the stock market right now without the appropriate hedges in place. I'm not calling for a crash, but I wouldn't be buying risk assets at the moment. Couple this with the second chart showing the S&P bouncing off of two VERY long-term resistance lines and you have the making of at least an intermediate term drop in the markets.
  • Bottom line - if you're looking at purchasing a few shares of your favorite stock I would wait a few days to weeks to buy at lower prices.
Long Term Gold-to-Silver Ratio

Monthly S&P 500 Index

2/23/2011 - Noon Update

S&P 500 Index Daily Chart
  • Wedge support has broken on the SPX watch for a further retrace to at least 1275, if that breaks watch for a move back to the 1220 area. Good luck.

Tuesday, February 22, 2011

Investment Newsletter coming this week!!

Starting this week Absolute Investments will be writing a weekly newsletter that will be published every Sunday night. It will give our technical and economic analysis, as well as two different portfolios to follow, one long only and one long short. The portfolios will only trade ETFs so as to to limit company specific risk and add to broad diversification. Look forward to it. If you'd like to subscribe to the newsletter just e-mail me at branthammer@gmail.com.

A quick update: Our last post was back in December where we identified a range breakout on the S&P 500 and predicted higher prices. That prediction came true. Today I'll provide two charts, the daily (short-term) chart and the longer term weekly S&P 500 chart. I'll explain more in this weeks newsletter, but the charts do a fairly decent job giving a market picture themselves.

S&P 500 Daily Chart

S&P 500 Weekly Chart


Wednesday, December 1, 2010

SPX Short-Term Update

  • Daily - Neutral
  • Weekly - Bullish
  • Monthly - Bullish
Note: More upside is to be expected in the short term, watch for breakout over April 2010 highs for a push towards 1300 SPX

SPX Daily

Short-Term Market Update

Daily - Neutral
Weekly - Bullish
Monthly - Bullish

Note: More upside is to be expected in the short term, watch for breakout over April 2010 highs for a push towards 1300 SPX.


Tuesday, September 28, 2010

Daily and Weekly S&P 500 Charts

  • The S&P is bullish on the weekly chart all the way to 1200, a break of that resistance zone would signal a lot of upside to come.
  • The daily chart is a little extended with numerous negative divergences. So, a small pullback is due, at minimum. We will watch key support levels for buying opportunities.


Weekly S&P 500

Daily S&P 500