Thursday, April 21, 2011

Pullback in Wind Energy... Good entry point

Wind Energy Weekly Chart (FAN)

Wind Energy is offering us a good buying opportunity on the latest pullback.... I'm loading up the truck. Watch for a move back towards and a break of the 12.50-13 area and a push towards 16.5 over the coming weeks to months.


Friday, April 1, 2011

China poised to move higher.....

China Index (FXI) Weekly Chart

  • This chart of the Chinese stock index shows two very bullish patterns for the intermediate to long-term. You can see a large cup & handle pattern starting in 2008 and another cup & handle pattern imbedded in the larger one, outlined in blue.
  • These patterns are very reliable and are signaling that China might be the place for equity investors over the next few years if the patterns materialize into breakouts.
  • China's fundamentals are not very good, with the massive real estate bubble that they have created and their large inflation that they can't seem to get control of. However, price doesn't lie and it should be the ultimate decider on making financial decisions.
  • Bottom line: I'm bullish on China if these patterns breakout, which it's looking like they will relatively soon.
I'm currently long NTES and SSRX, both Chinese companies.

Thursday, March 31, 2011

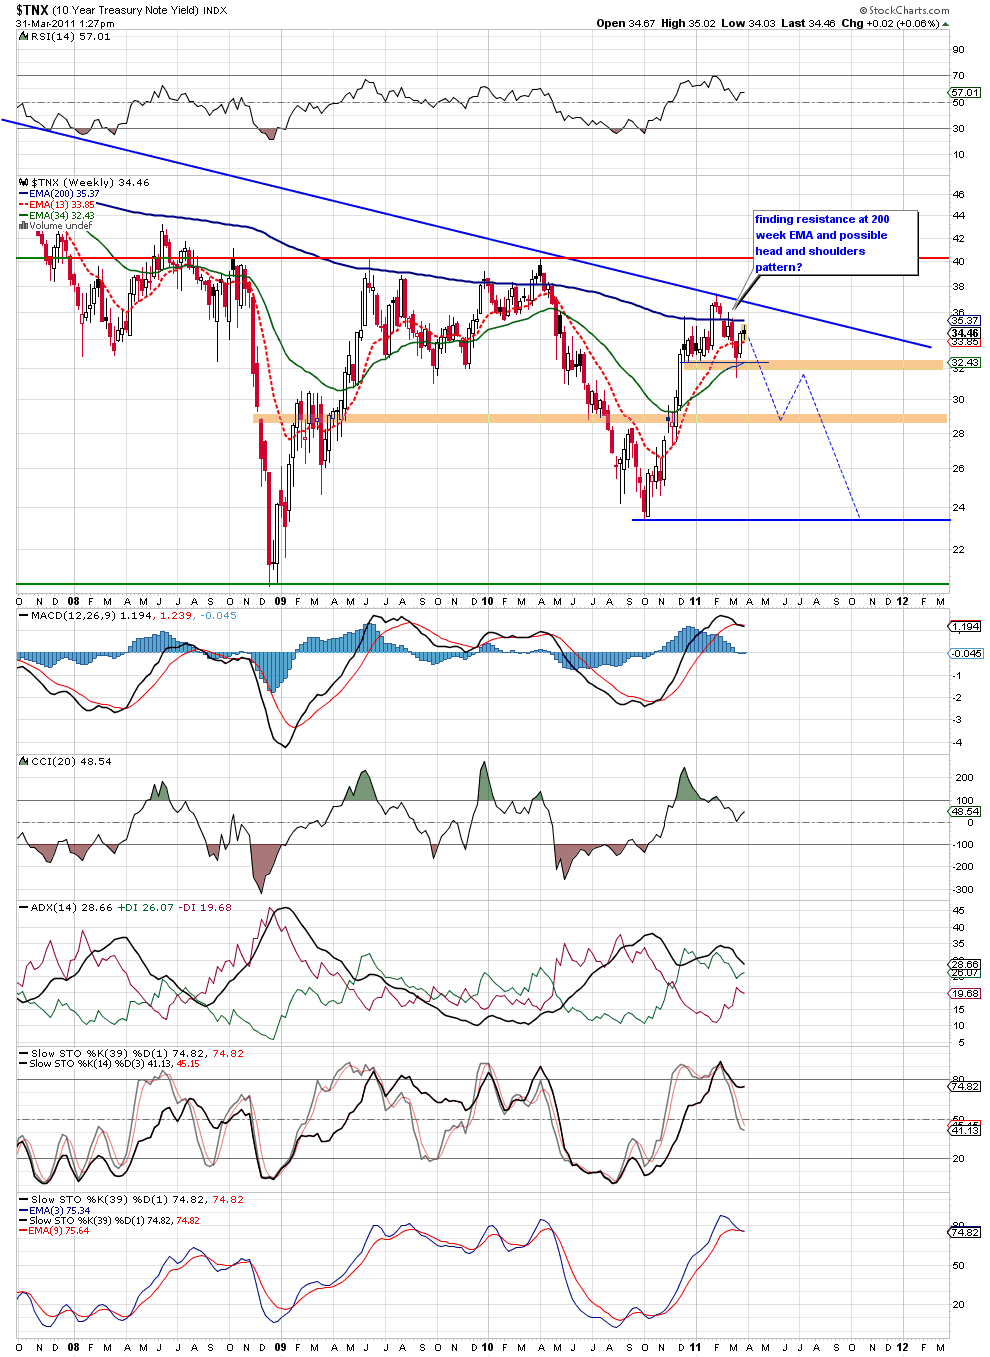
10-Year Yield could take a dive in the near future

10-Year Treasury Yield Weekly Chart

  • Classic head and shoulders pattern on the 10-year yield setting up just below the declining 200 week EMA and the declining trend line. This is pretty bearish for the 10-year yield.
  • I suspect we will see a fall here in the next month or so. Goes pretty well with what I suspect to be another bout of deflation here in the United States in the later half of the year after QE II ends in June.

Monday, March 28, 2011

Watching for breakout in home construction

US Home Construction ETF (ITB) Daily Chart


  • I'm watching this breakout of the falling wedge in US Home Construction ETF (ITB).
  • It has rallied out of the wedge and is now facing resistance from its first pivot point. Watch for a break above the blue dashed line. This would be a good time to add some ITB to your portfolio for a short term trade.
  • If the ETF breaks the pivot buy point watch for a move to test the 2011 highs and possibly new 52-week highs.
  • A good move would be to find some of the better performing companies that make up the ETF and jump in one of those rather than buying the whole ETF. It's better to have one good company than a bunch of good ones and a bunch of bad ones, especially in a sector like home construction that has a lot of losers in it.
Wind Energy ETF (FAN) Weekly Chart
  • As predicted here last week, I stated,
    "FAN broke out of a strong basing pattern on HUGE volume, showing strong accumulation, and seems to be moving towards resistance in the $12.50 area."
  • This week nothing is different. FAN has opened Monday by shooting up 2.5%. It's too late to chase this one now, but I will be a buyer on any orderly pullback near the $11 dollar area.
  • I hope you didn't make the same mistake as me and caught this one before it exploded.

Thursday, March 24, 2011

Minefinders Corp. Ltd.

Minefinders Corp. (MFN) Weekly Chart
  • Minefinders Corp. Ltd. (MFN) is a great mining company to take advantage of the rise in precious metals prices during the last decade. The company engages in the exploration, development, and mining of precious and base metal properties in Mexico and the United States. It principally owns a 100% interest in the Dolores Mine, an open pit, heap leach gold and silver mine located in the Sierra Madre Occidental Range in the State of Chihuahua, northern Mexico.
  • The technicals on MFN are absolutely perfect. The stock is currently breaking out of a text book consolidation pattern to new 52-week highs. Accumulation is strong as evidenced by the breakout occurring on explosive volume. All of the indicators are in buy territory and there is no solid resistance anywhere overhead. The sky is the limit for MFN.
  • The fundamentals for Minefinders are also solid. Quarterly earnings from a year ago are up 157% and EPS estimates for current quarter have risen 1400% and current year are up 633%. Institutional investors are also taking notice of MFN. From last quarter the % change in funds owning the stock is 4%. Demand for the stock is there, the price should follow it up.
Good trading.

Wind Energy (FAN) catching a bid

Wind Energy (FAN) Weekly Chart
  • The Wind Energy ETF (FAN) seems to be catching a big the last two weeks after a steep decline during 2010.
  • The nuclear disaster in Japan, as awful as it is, has been a large benefit to the Wind Energy sector. This, in my opinion, has been the catalyst for the move in FAN. For more information on the fundamentals behind this rally see this, this, and this.
  • FAN broke out of a strong basing pattern on HUGE volume, showing strong accumulation, and seems to be moving towards resistance in the $12.50 area.
  • Some firms in this sector should be some pretty decent investments during 2011.