| The Daily Show With Jon Stewart | Mon - Thurs 11p / 10c | |||
| ||||
Thursday, July 30, 2009
hmmmm? lol

Thursday, July 23, 2009
Goldman leading the way?

Goldman is just destroying everything in it's path.....
who could have guessed?
Goldman leading the way?
Goldman is just destroying everything in it's path.....
who could have guessed?
DTV?
DTV looks like an interesting buy today......market is very overbought, however shorts are just not working...could be worth a shot
DTV?
DTV looks like an interesting buy today......market is very overbought, however shorts are just not working...could be worth a shot


Monday, July 13, 2009
Bank index breaking out?
Looks like we could have another leg of this huge topping pattern if the bank index moves to the upside today


Saturday, July 11, 2009

Thursday, July 9, 2009
Wow!! Is Goldman Stealing $100 Million per Trading Day?
Via: The Big Picture:
Here’s something to give the conspiracy buffs a total breakdown: Combine these stories from Bloomberg, Daily Kos, and Zero Hedge, and you can reach a rather unsavory conclusion:
• Goldman Sachs’s $100 Million Trading Days Hit Record
• FBI Arrest Opens Goldman-Sachs’ Pandora’s Box
• “Incredibly Shrinking Liquidity” as Goldman Flushed Quant Trading
What is the inference of potentially illegality here?
“That Goldman Sachs may just possibly have used security access codes and built a system to acquire trading information PRIOR to transaction commit time points at NYSE.
The profitability of this split-second information advantage would have been and could have been extraordinary. Observed yielding profits at $100,000,000 a day. [summary to address complaints with respect to complexity.]
GS has special access inside the system from its status assisting the Working Group on Financial Markets (colloquially the Plunge Protection Team) created by Presidential Order two decades ago. GC also acts as Special Liquidity Provider for NYSE.
With 60% dominance of NYSE program trading, what’s good for Goldman defines what shows as overall market performance.”
There is likely to be more info about this trickling out over the coming days and weeks. Stay tuned . . .
Wednesday, July 8, 2009
FDIC Gearing Up for Bank Failures
Via: Washington Business Journal:
The Federal Deposit Insurance Corp. is gearing up to handle a large number of bank failures expected as a result of bad mortgages, both in residential and commercial real estate, an economist said Tuesday.
“They know they’re going to take down a large number of banks and they can’t do it until they’re staffed up,” said Mark Dotzour, chief economist and director of research for the Real Estate Center at Texas A&M University.
Dotzour expects federal regulators to establish an agency, similar to the Resolution Trust Corp. that disposed of assets belonging to insolvent S&Ls in the late 1980s and early 1990s.
“Once they start to sell [foreclosed real estate], we’ll find out what the market really is,” Dotzour told attendees at an economic summit hosted by a handful of real estate groups in Tampa, Fla.
…
Dotzour expects foreclosure rates to continue to climb, real estate prices to fall more and cap rates to rise to at least 9 percent before leveling off.
In 2010 and 2011, interest rates will begin to rise, as will inflation. Once investors realize the market is at bottom, deals will begin to flow again, he said.
In the meantime, he compared the bad loans that remain on banks’ books to a smelly cat litter box and the feds keep throwing more litter on top to mask the smell. But they’ll eventually have to remove the organic material to fix the problem.
It’s Not About U.S.
Via: Financial Sense:
While the world has been used to the U.S. being the engine that drives global economic growth, this decade we witnessed the resurgence of developing nations with popularized terms such as “Chindia” (China/India) and “BRICs” (Brazil, Russia, India, China). There has truly been a shift in importance coming from developing nations and it is showing on multiple fronts, including share of world market capitalization. The U.S. share of world market cap has fallen from roughly 45% in 2003 to 29% currently, while China’s share has risen from roughly 1% to 9% over the same period. The second chart, of the U.S. dollar, shows how the currency markets are responding to U.S. weakness.


Real Estate Recovery?
Via: Bloomberg:
July 8 (Bloomberg) -- Commercial properties in the U.S. valued at more than $108 billion are now in default, foreclosure or bankruptcy, almost double than at the start of the year, Real Capital Analytics Inc. said.
There were 5,315 buildings in financial distress at the end of June, the New York-based real estate research firm said in a report issued today. That’s more than twice the number of troubled properties at the end of 2008.
Hotels and retail properties are among the most “problematic” assets following bankruptcy filings by mall owner General Growth Properties Inc. and Extended Stay America Inc., according to the report. The scarcity of credit is causing property defaults in all regions and among every investor type, Real Capital said.
“Perhaps more alarming than the rapid growth in the distress totals is the very modest rate at which troubled situations are being resolved,” the report said.
About $4.1 billion of commercial properties have emerged from distress, according to Real Capital.
“In far more situations, modifications and short-term extensions are being granted, but these can hardly be considered resolved, only delayed,” the study said.
The June figures issued today are preliminary.

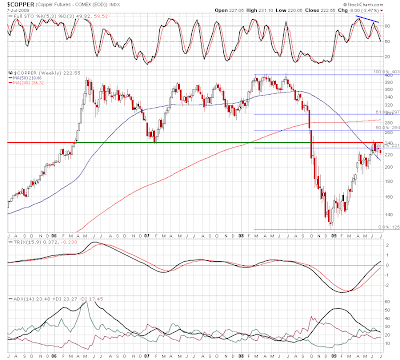
Can Copper keep it up??
I don't see copper continuing its run much further. It has run into heavy resistance on it's weekly chart and has painting a nasty negative divergence on the stochastics. Translation: Copper is due for a pullback. I'm going to play this by shorting Freeport Macmoran (FCX)


Short AAPL
Going short AAPL here.....good breakdown yesterday and I see weakness continuing going forward for both AAPL and the overall market.


True Unemployment Rate Already at 20%
Great article from MSN, take the time to read it
Via: MSN:
Via: MSN:
Really, how hard is it to find a job? Was June’s horrid numbers, in which 467,000 people lost their jobs compared to 345,000 in May, a one-time fluke? Or does it mean that all those Wall Street economists who believe the economic recovery is starting are dead wrong?
Not to scare you, but the situation is actually worse than it seems. Over the years, the government has changed the way it counts the unemployed. An example of this is the criticized Birth-Death Model which was added in 2000. The model is designed to account for the birth and death of businesses and the resultant lag in survey data. Unfortunately, the model doesn’t work that well during economic contractions (like we have now) and consistently overstates the number of jobs being created each month.
John Williams of Shadow Government Statistics specializes in removing these questionable tweaks to the government’s statistical data to better align current numbers with the methodology used to gather historical data. After reviewing the data, Williams believes that “the June jobs loss likely exceeded 700,000.” David Rosenberg of Gluskin Sheff notes that the fall in the number of hours worked in June (to a record low of 33 per week) is equivalent to a loss of more than 800,000 jobs.
There are similar issues with the way the unemployment rate is measured. The headline rate only jumped from 9.4% to 9.5% because of a drop in the number of people in the workforce. The more inclusive “U-6″ measure of unemployment, which includes discouraged workers, jumped from 16.4% to 16.5%. But even this doesn’t adequately capture the situation on the ground: Back in the Clinton Administration, the definition of discouraged worker was changed to only include those that had given up looking for work because there were no jobs to be had within the last year.
By adding these folks back in, William’s SGS-Alternate Unemployment Measure rose to a jaw-dropping 20.6%. Separately, the Center for Labor Market Studies in Boston puts U.S. unemployment at 18.2%. Any way you cut the numbers, the situation is very bad. According to David Rosenberg, one-in-three among the unemployed have been looking for a job for more than six months and still can’t find one.
Tuesday, July 7, 2009
Nasdaq breakdown
The Nasdaq is breaking down below the neckline of it's head and shoulders pattern as well as it's 50 day moving average. This is a signal for further weakness ahead.
Nasdaq breakdown
The Nasdaq is breaking down below the neckline of it's head and shoulders pattern as well as it's 50 day moving average. This is a signal for further weakness ahead.


Tech Sector Collapse
The Tech sector, which has lead the recent rally, is currently breaking down. Multiple head and shoulders patterns on the biggest tech names are playing out as we speak. This is not good for the stock market going forward.


America's Fiscal Train Wreck
Good article by Morgan Stanley on the debt situation in the United States
http://www.morganstanley.com/views/gef/index.html#anchor098c0c3c-6a29-11de-9228-3fb01e8a07e2
http://www.morganstanley.com/views/gef/index.html#anchor098c0c3c-6a29-11de-9228-3fb01e8a07e2
Article on Goldman Sachs
Matt Taibbi on how Goldman Sachs has engineered every major market manipulation since the Great Depression
http://www.rollingstone.com/politics/story/28816321/the_great_american_bubble_machine
U.S. debt from a different perspective
You're eight months behind on your $500,000 mortgage, your bank is
demanding a meeting, and you respond by telling them there's nothing to
worry about. Why not? Because you just saved $40 by canceling your
newspaper subscription.
That, essentially, is the kind of fast budget talk President Obama
trotted out in April when he made a big to-do out of instructing his
cabinet to cut $100 million from their budgets.
$100 million may sound like a big number, but the cut would only reduce
the United States' projected $1.8 trillion budget deficit by 0.005% --
less than what you'd save for your mortgage by giving up the daily
paper.
Friday, July 3, 2009
Doesn't look good for equities....
Here is a weekly chart of the volatility index. IMO it doesn't look very good for stocks.


Thursday, July 2, 2009

bear trap?
I am not bullish on this market, however we must keep in mind that this could be a bear trap.....
here are a few bullish set-ups to watch


here are a few bullish set-ups to watch


Pairs trade to play the currency market
Yesterday I showed a chart of the Euro/Yen.....
Today I am going to put on a pair trade to play this currency pair....
I am entering a long positions in FXY with a stop at $102.50 and a short position in FXE with a stop at $142.50
good trading!!
Today I am going to put on a pair trade to play this currency pair....
I am entering a long positions in FXY with a stop at $102.50 and a short position in FXE with a stop at $142.50
good trading!!

Short IYR.....stop at $33.50

I am going to short IYR with a stop at $33.50........aggressive players can buy SRS (ultrashort real estate)
The market is currently breaking down as expected...........if it moves lower than 890 the H&S pattern will become a reality and 800 should follow in short order. A look at the advances/decliners shows that there is ample room for more downside.


Wednesday, July 1, 2009
Real Estate recovering?

This is IYR, a chart of the real estate index............looks like a screaming sell to me, overbought, kissing the 200 day MA, and forming the right shoulder of a textbook H&S pattern...
Euro/Yen

This is just a secondary indicator I like to use to confirm stock market movements. It is a measure of risk. If it is rising the currency markets believe the economy to be healthy. Right now it is looking rather toppy and could be setting up for a fall......bad for the stock market
Market very toppy.....

Market is looking very toppy, I'm looking to add a few short positions before the close today.....stops should be tightened up on any open longs
Short Oil?

Oil is looking like a good short right now....this could be a sign that this rally is nearing completion.....
I'm going short with a stop at $38.95
Subscribe to:
Comments (Atom)